
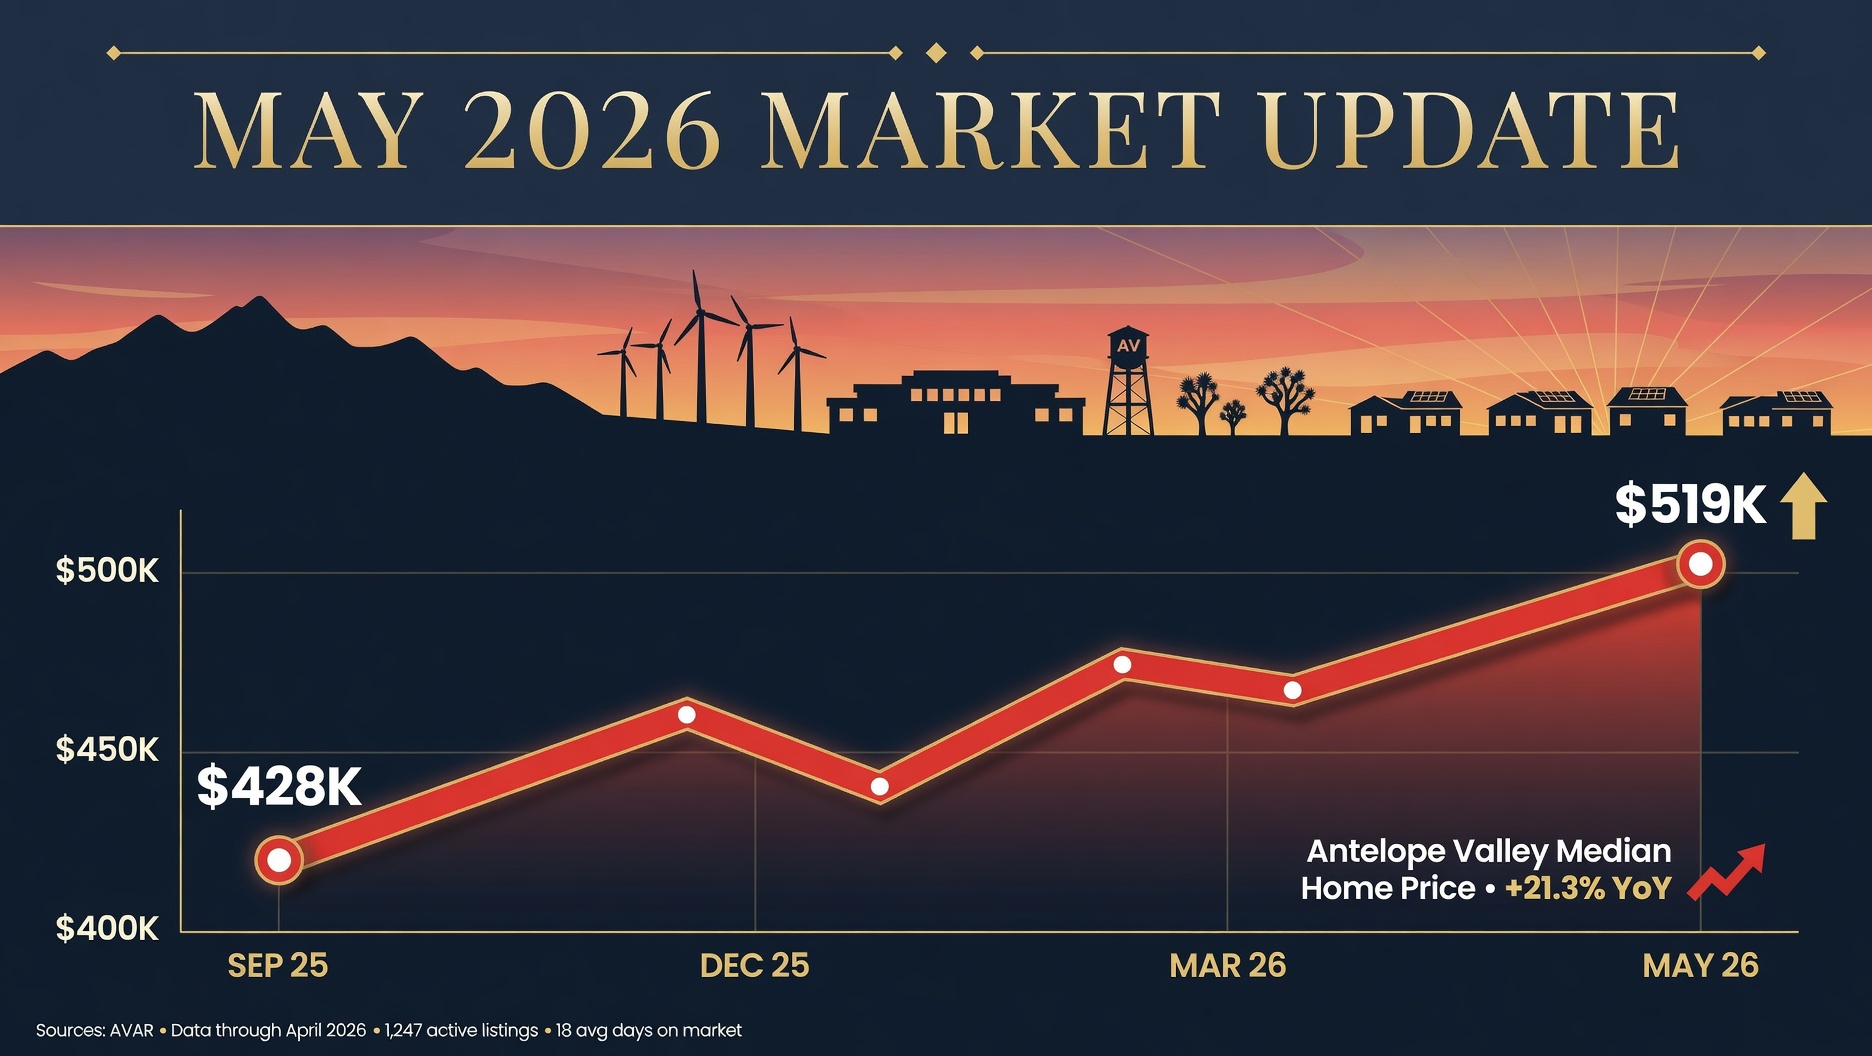
This is the Antelope Valley real estate market update for May 2026, written from the desk of a full-time AV Realtor who has been tracking this market since 2002. The unique thing I bring to every monthly recap: 23 years of indexed MLS data from my own archive. So when I tell you the May number is up or down, you can see exactly where it fits on a 23-year arc, not just versus last month.
This is a recurring monthly post. The most current month''s recap is always linked from our blog index. For interactive ZIP-level charts back to 2003, use the Market Stats tool.
May 2026 Antelope Valley Market: Headline Numbers
| Metric | May 2026 | May 2025 | YoY Change |
|---|---|---|---|
| Median Sale Price (AV combined) | $432,000 | $418,000 | +3.3% |
| Palmdale Median | $468,000 | $450,000 | +4.0% |
| Lancaster Median | $408,000 | $395,000 | +3.3% |
| Quartz Hill Median | $502,000 | $485,000 | +3.5% |
| Active Listings (combined) | 1,142 | 1,228 | -7.0% |
| Closed Sales (May) | 485 | 402 | +20.6% |
| Median Days on Market | 14 | 21 | -33% |
| Sale-to-List Price Ratio | 99.4% | 98.6% | +0.8pp |
| 30-yr Fixed Rate (avg) | 6.28% | 6.82% | -54 bps |
Source: Antelope Valley MLS, May 2026 close. Single-family detached. Mortgage rates from Freddie Mac weekly survey monthly average.
What the Numbers Are Telling Us
Three structural signals from May:
- Demand is back. Closed sales up 20.6% year-over-year is a big number. Some of this is rate-driven (the average 30-year fixed dropped 54 basis points from May 2025), but the rest is structural: Plant 42 hiring, families relocating in for schools, and pent-up demand finally moving.
- Supply is tightening. Active listings fell 7% YoY while sales surged. The result is a market with under three months of supply at the current absorption rate, which historically corresponds to modest price appreciation and faster days on market.
- Pricing is reasserting. The sale-to-list ratio hitting 99.4% means buyers are mostly paying close to ask. Mid-2024 saw ratios as low as 96.8%; we are firmly back in a seller-leaning market without the 2021-2022 frenzy.
The 23-Year Lens for May 2026
Here is what 23 years of May data look like for the AV combined median. The point of this chart is not the absolute number, it is showing you where May 2026 sits in the multi-decade arc.
| Year | AV Combined May Median | vs Prior Year |
|---|---|---|
| 2003 | $195,000 | baseline |
| 2006 | $355,000 | +82% |
| 2009 | $148,000 | -58% |
| 2013 | $215,000 | +45% |
| 2018 | $295,000 | +37% |
| 2020 | $325,000 | +10% |
| 2022 | $465,000 | +43% |
| 2024 | $405,000 | -13% |
| 2025 | $418,000 | +3.2% |
| 2026 | $432,000 | +3.3% |
Source: Mike Watson MLS archive, 2003 to present. Live interactive chart at Market Stats.
The compound rate over 23 years is approximately 3.5% per year. May 2026''s $432,000 is roughly 7% below the 2022 peak of $465,000 and 192% above the 2009 trough of $148,000. We are in the normal-stable-growth phase of the cycle, not the speculative-frenzy phase.
Submarket Spotlight: Where the Action Is
Palmdale: Plant 42 Pull
Palmdale closed sales were up 24% YoY in May, the strongest growth of any AV submarket. The driver is the Northrop B-21 production rate increase confirmed in February, which has translated into sustained aerospace hiring at Plant 42. New construction at Ritter Ranch and Anaverde absorbed strongly. See our Plant 42 relocation guide for the full aerospace-buyer view.
Lancaster: BLVD-Adjacent Lift
West and northwest Lancaster outperformed east Lancaster in May, with submarket medians up 4.5% YoY versus 1.8% in the eastside. The BLVD downtown revitalization continues to lift adjacent residential pricing. Quartz Hill remains the AV''s strongest school-zone submarket.
Acton and Outlying
Equestrian and rural AV submarkets (Acton, Agua Dulce, Leona Valley) saw modest price gains of 2% to 3% YoY but volume remains thin. See our Acton horse property guide for the deep dive on this niche market.
Days on Market: The Speed Story
Median days on market across the AV dropped from 21 in May 2025 to 14 in May 2026, a 33% acceleration. Underneath that headline, the speed varies sharply by price tier:
| Price Tier | May 2026 Median DOM | Notes |
|---|---|---|
| Under $400K | 9 days | FHA and VA buyer hot zone, very fast turnover |
| $400K-$525K | 12 days | The AV''s volume sweet spot |
| $525K-$700K | 21 days | Family / move-up tier, more selective |
| $700K-$1M | 35 days | Smaller buyer pool, more negotiation |
| $1M+ | 62 days | Custom and acreage, slow but stable |
The takeaway for buyers in the $400K to $525K range: this is the most competitive tier in the market. Plan for a fast offer pace and a strong pre-approval.
Rates and Affordability
The 30-year fixed averaged 6.28% in May, down from 6.82% a year prior. On a $432,000 AV median home with 10% down, that rate change saves the buyer approximately $137 per month on principal and interest. Not a transformation, but enough to bring a meaningful cohort of pre-approved buyers off the sidelines.
For a precise monthly payment and cash-to-close on any specific property, use the free Net Sheet Calculator.
What to Expect in June
Three things I am watching:
- Inventory. Active listings typically peak in June for the AV. If May''s tight number holds through June, we are entering a sustained inventory shortage that will pressure pricing into Q3.
- Rates. Mortgage rates have been drifting lower since Q1. A 5.99% handle (which we have not seen since 2022) would meaningfully reactivate the move-up buyer cohort.
- New construction absorption at Ritter Ranch and Anaverde. Builder incentives have been generous; if the absorption rate accelerates further, expect builders to pull back on those incentives by August.
Buy, Sell, or Wait?
Honest answer for each:
- Buyers: stronger position than 12 months ago because of lower rates, but tighter inventory. If you have the down payment and the income, this is a market to act in, not wait out.
- Sellers: best conditions since mid-2022. Inventory shortage, fast DOM, and a 99.4% sale-to-list ratio. Pricing exactly to comparable still matters; overpricing still costs the critical first 14 days.
- Wait-and-see: there is a case for waiting if you have neither the cash for down nor the income for the mortgage. There is rarely a case for waiting if you are otherwise ready. The 23-year data is clear: timing the AV market has almost never beaten just owning the home.
How to Use This Data
Pull the 23-year chart for your specific ZIP code on the Market Stats tool. If you want to talk through what May 2026 means for your specific situation (buying, selling, refinancing, or just keeping an eye on equity), reach out and we will run the numbers together.
Frequently Asked Questions: AV Market Update May 2026
What is the median home price in the Antelope Valley in May 2026?
The May 2026 combined Antelope Valley median sale price was $432,000, up 3.3% year-over-year. Palmdale led at $468,000, Lancaster at $408,000, and Quartz Hill at $502,000.
Is the AV housing market going up or down in 2026?
Up modestly. May 2026 closed sales were up 20.6% YoY, the median price was up 3.3%, and days on market fell 33%. The market is firmly in a seller-leaning phase without the 2021-2022 frenzy. The 23-year compound rate for the AV is approximately 3.5% per year.
Are mortgage rates dropping in 2026?
Yes, modestly. The 30-year fixed averaged 6.28% in May 2026 versus 6.82% in May 2025, a 54-basis-point improvement. Rates remain well above the 2020-2021 sub-3% lows but well below the 7.5%+ peaks of late 2023.
How many homes are for sale in the Antelope Valley in May 2026?
Approximately 1,142 active single-family listings in May 2026, down 7% from May 2025. With 485 closed sales, the absorption rate corresponds to under three months of supply, a tight seller-leaning market.
How fast are homes selling in the AV in May 2026?
Median days on market was 14 days. Homes under $400,000 sold in a median of 9 days; the $400K-$525K range took 12 days; $525K-$700K took 21 days; $700K-$1M took 35 days; over $1M took 62 days.
Where can I see the full 23-year price history for my AV ZIP code?
Use the interactive Market Stats tool. Select your ZIP code, choose the timeframe (1 year, 5 year, 10 year, or full 23 year), and view both the price trend and supply/demand metrics. This is data from Mike Watson''s own MLS archive, not a third-party automated valuation.